JupyterBook Demonstration#
This document demonstrates some of the features provided by the documentation. It can serve as a starting point for your own documentation.
This documentation is formatted using an extension to Markdown called MyST which allows full interoperability with Sphinx, the system used to build the documentation. Here we demonstrate some features. For more details, please see:
Math#
You can use LaTeX math with [MathJaX][].
Example#
Here we implement a simple example of a pendulum of mass \(m\) hanging down distance \(r\) from a pivot point in a gravitational field \(g>0\) with coordinate \(\theta\) so that the mass is at \((x, z) = (r\sin\theta, -r\cos\theta)\) and \(\theta=0\) is the downward equilibrium position:
Note
On [CoCalc][], only a subset of the math will render in the live Markdown editor. This
uses KaTeX, which is much faster than [MathJaX][], but more limited. The final
documentation will use [MathJaX][], and loads the macros defined in
Docs/_static/math_defs.tex.
SI Units#
In LaTeX, I like to use the siunitx package. This is not currently supported in
MathJax (they could not get funding),
but can be mocked up with some defines.
The idea is that we use the macros for HTML, but substitute the appropriate
\usepackage{siunitx} in the LaTeX files. (This second step is currently not implemented)
Jupyter Notebooks#
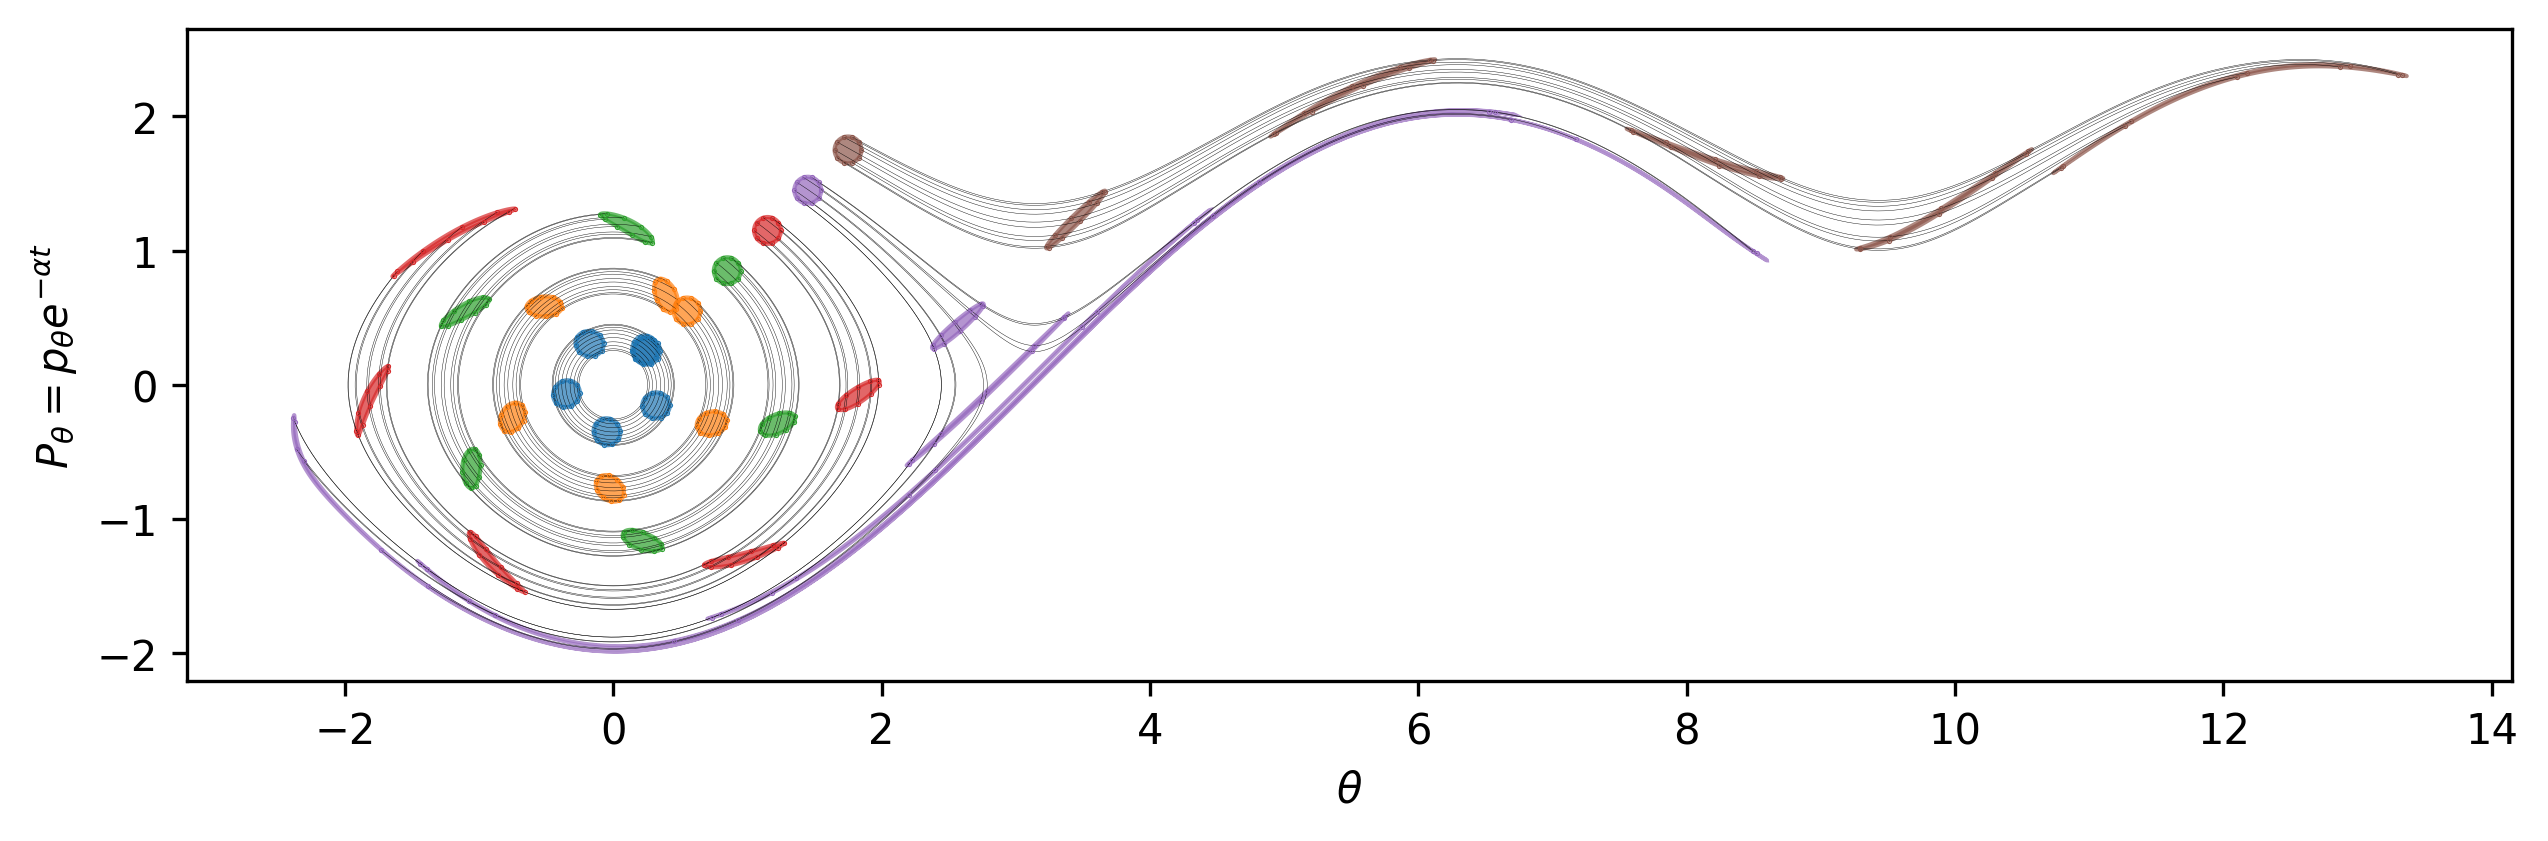
This document is actually a Jupyter notebook, synchronized with Jupytext. The top of the document contains information about the kernel that should be used etc. These are parsed using MyST-NB and the output of cells will be displayed. For example, here is a plot demonstrating Liouville’s Theorem.
Details
We start a code-block with:
```{code-cell}
:tags: [hide-input, full-width]
...
```
This indicates that it is a code cell, to be run with python 3, and has some tags to make the cell and output full width, but hiding the code. (There is a link to click to show the code.)
If you need more control, you can glue the output to a variable, then load it as a proper figure, insert it in a table, etc.
Manim#
We provide experimental support for Manim Community – the community edition of the animation software used by the 3Blue1Brown project. Here we demonstrate an animation of the Jacobi elliptic functions.
Manim Community v0.19.0
[09/03/25 23:59:33] ERROR    LaTeX compilation error: LaTeX Error: Command \= already       tex_file_writing.py:314
                             defined.
                    ERROR    Context of error:                                              tex_file_writing.py:348
                             \usepackage[english]{babel}
                             \usepackage{amsmath}
                             -> \usepackage{amssymb}
                             \newcommand{\=}{\;\mathrm{^{“}\!\!=^{”}}}
                             % \newcommand{\vect}[1]{\boldsymbol{#1}}
                             \newcommand{\uvec}[1]{\hat{#1}}
---------------------------------------------------------------------------
ValueError                                Traceback (most recent call last)
Cell In[4], line 1
----> 1 get_ipython().run_cell_magic('manim', '-v WARNING --progress_bar None -qm JacobiEllipse', 'from scipy.special import ellipj, ellipkinc\nfrom manim import *\n\nconfig.media_width = "100%"\nconfig.media_embed = True\n\nmy_tex_template = TexTemplate()\nwith open("_static/math_defs.tex") as f:\n    my_tex_template.add_to_preamble(f.read())\n\ndef get_scd(phi, k):\n    m = k**2\n    u = ellipkinc(phi, m)\n    s, c, d, phi_ = ellipj(u, m)\n    return s, c, d\n\ndef get_xyr(phi, k):\n    s, c, d = get_scd(phi, k)\n    r = 1/d\n    x, y = r*c, r*s\n    return x, y, r\n\nclass JacobiEllipse(Scene):\n    def construct(self):\n        config["tex_template"] = my_tex_template\n        config["media_width"] = "100%"\n        class colors:\n            ellipse = YELLOW\n            x = BLUE\n            y = GREEN\n            r = RED\n\n        phi = ValueTracker(0.01)\n        k = 0.8\n        axes = Axes(x_range=[0, 2*np.pi, 1], \n                    y_range=[-2, 2, 1],\n                    x_length=6, \n                    y_length=4,\n                    axis_config=dict(include_tip=False),\n                    x_axis_config=dict(numbers_to_exclude=[0]),\n                   ).add_coordinates()\n\n\n        plane = PolarPlane(radius_max=2).add_coordinates()\n\n        x = lambda phi: get_xyr(phi, k)[0]\n        y = lambda phi: get_xyr(phi, k)[1]\n        r = lambda phi: get_xyr(phi, k)[2]\n\n        g_ellipse = plane.plot_polar_graph(r, [0, 2*np.pi], color=colors.ellipse)\n\n        points_colors = [(x, colors.x), (y, colors.y), (r, colors.r)]\n        x_graph, y_graph, r_graph = [axes.plot(_x, color=_c) for _x, _c in points_colors]\n        graphs = VGroup(x_graph, y_graph, r_graph)\n\n        dot = always_redraw(lambda:\n            Dot(plane.polar_to_point(r(phi.get_value()), phi.get_value()), \n                fill_color=colors.ellipse, \n                fill_opacity=0.8))\n\n        @always_redraw\n        def lines():\n            c2p = plane.coords_to_point\n            phi_ = phi.get_value()\n            x_, y_ = x(phi_), y(phi_)\n            return VGroup(\n                Line(c2p(0, 0), c2p(x_, 0), color=colors.x),\n                Line(c2p(0, y_), c2p(x_, y_), color=colors.x),\n                Line(c2p(0, 0), c2p(0, y_), color=colors.y),\n                Line(c2p(x_, 0), c2p(x_, y_), color=colors.y),\n                Line(axes.c2p(phi_, y_), c2p(x_, y_), color=colors.y),\n                Line(c2p(0, 0), c2p(x_, y_), color=colors.r),\n            ).set_opacity(0.8)\n\n        dots = always_redraw(lambda:\n            VGroup(*(Dot(axes.c2p(phi.get_value(), _x(phi.get_value())), fill_color=_c, fill_opacity=1)\n                     for _x, _c in points_colors)))\n\n        a_group = VGroup(axes, dots, graphs)\n        p_group = VGroup(plane, g_ellipse, dot, lines)\n        a_group.shift(RIGHT*2)\n        p_group.shift(LEFT*4)\n\n        labels = VGroup(\n            axes.get_graph_label(\n                x_graph, label=r"x=\\cn(u, k)", color=colors.x,\n                x_val=2.5, direction=DOWN).shift(0.2*LEFT),\n            axes.get_graph_label(\n                y_graph, label=r"y=\\sn(u, k)", color=colors.y,\n                x_val=4.5, direction=DR),\n            axes.get_graph_label(\n                r_graph, label=r"r=1/\\dn(u, k)", color=colors.r,\n                x_val=2, direction=UR),\n        )\n        #labels.next_to(a_group, RIGHT)\n        self.add(p_group, a_group, labels)\n        self.play(phi.animate.set_value(2*np.pi), run_time=5, rate_func=linear)\n')

File ~/checkouts/readthedocs.org/user_builds/physics-555-quantum-technologies/conda/fall2024/lib/python3.11/site-packages/IPython/core/interactiveshell.py:2565, in InteractiveShell.run_cell_magic(self, magic_name, line, cell)
   2563 with self.builtin_trap:
   2564     args = (magic_arg_s, cell)
-> 2565     result = fn(*args, **kwargs)
   2567 # The code below prevents the output from being displayed
   2568 # when using magics with decorator @output_can_be_silenced
   2569 # when the last Python token in the expression is a ';'.
   2570 if getattr(fn, magic.MAGIC_OUTPUT_CAN_BE_SILENCED, False):

File ~/checkouts/readthedocs.org/user_builds/physics-555-quantum-technologies/conda/fall2024/lib/python3.11/site-packages/manim/utils/ipython_magic.py:143, in ManimMagic.manim(self, line, cell, local_ns)
    141     SceneClass = local_ns[config["scene_names"][0]]
    142     scene = SceneClass(renderer=renderer)
--> 143     scene.render()
    144 finally:
    145     # Shader cache becomes invalid as the context is destroyed
    146     shader_program_cache.clear()

File ~/checkouts/readthedocs.org/user_builds/physics-555-quantum-technologies/conda/fall2024/lib/python3.11/site-packages/manim/scene/scene.py:237, in Scene.render(self, preview)
    235 self.setup()
    236 try:
--> 237     self.construct()
    238 except EndSceneEarlyException:
    239     pass

File <string>:41, in construct(self)

File ~/checkouts/readthedocs.org/user_builds/physics-555-quantum-technologies/conda/fall2024/lib/python3.11/site-packages/manim/mobject/graphing/coordinate_systems.py:445, in CoordinateSystem.add_coordinates(self, *axes_numbers, **kwargs)
    443     labels = axis.labels
    444 else:
--> 445     axis.add_numbers(values, **kwargs)
    446     labels = axis.numbers
    447 self.coordinate_labels.add(labels)

File ~/checkouts/readthedocs.org/user_builds/physics-555-quantum-technologies/conda/fall2024/lib/python3.11/site-packages/manim/mobject/graphing/number_line.py:540, in NumberLine.add_numbers(self, x_values, excluding, font_size, label_constructor, **kwargs)
    537     if x in excluding:
    538         continue
    539     numbers.add(
--> 540         self.get_number_mobject(
    541             x,
    542             font_size=font_size,
    543             label_constructor=label_constructor,
    544             **kwargs,
    545         )
    546     )
    547 self.add(numbers)
    548 self.numbers = numbers

File ~/checkouts/readthedocs.org/user_builds/physics-555-quantum-technologies/conda/fall2024/lib/python3.11/site-packages/manim/mobject/graphing/number_line.py:478, in NumberLine.get_number_mobject(self, x, direction, buff, font_size, label_constructor, **number_config)
    475 if label_constructor is None:
    476     label_constructor = self.label_constructor
--> 478 num_mob = DecimalNumber(
    479     x, font_size=font_size, mob_class=label_constructor, **number_config
    480 )
    482 num_mob.next_to(self.number_to_point(x), direction=direction, buff=buff)
    483 if x < 0 and self.label_direction[0] == 0:
    484     # Align without the minus sign

File ~/checkouts/readthedocs.org/user_builds/physics-555-quantum-technologies/conda/fall2024/lib/python3.11/site-packages/manim/mobject/text/numbers.py:136, in DecimalNumber.__init__(self, number, num_decimal_places, mob_class, include_sign, group_with_commas, digit_buff_per_font_unit, show_ellipsis, unit, unit_buff_per_font_unit, include_background_rectangle, edge_to_fix, font_size, stroke_width, fill_opacity, **kwargs)
    118 self.initial_config = kwargs.copy()
    119 self.initial_config.update(
    120     {
    121         "num_decimal_places": num_decimal_places,
   (...)    133     },
    134 )
--> 136 self._set_submobjects_from_number(number)
    137 self.init_colors()

File ~/checkouts/readthedocs.org/user_builds/physics-555-quantum-technologies/conda/fall2024/lib/python3.11/site-packages/manim/mobject/text/numbers.py:161, in DecimalNumber._set_submobjects_from_number(self, number)
    158 self.submobjects = []
    160 num_string = self._get_num_string(number)
--> 161 self.add(*(map(self._string_to_mob, num_string)))
    163 # Add non-numerical bits
    164 if self.show_ellipsis:

File ~/checkouts/readthedocs.org/user_builds/physics-555-quantum-technologies/conda/fall2024/lib/python3.11/site-packages/manim/mobject/text/numbers.py:223, in DecimalNumber._string_to_mob(self, string, mob_class, **kwargs)
    220     mob_class = self.mob_class
    222 if string not in string_to_mob_map:
--> 223     string_to_mob_map[string] = mob_class(string, **kwargs)
    224 mob = string_to_mob_map[string].copy()
    225 mob.font_size = self._font_size

File ~/checkouts/readthedocs.org/user_builds/physics-555-quantum-technologies/conda/fall2024/lib/python3.11/site-packages/manim/mobject/text/tex_mobject.py:298, in MathTex.__init__(self, arg_separator, substrings_to_isolate, tex_to_color_map, tex_environment, *tex_strings, **kwargs)
    285     if self.brace_notation_split_occurred:
    286         logger.error(
    287             dedent(
    288                 """\
   (...)    296             ),
    297         )
--> 298     raise compilation_error
    299 self.set_color_by_tex_to_color_map(self.tex_to_color_map)
    301 if self.organize_left_to_right:

File ~/checkouts/readthedocs.org/user_builds/physics-555-quantum-technologies/conda/fall2024/lib/python3.11/site-packages/manim/mobject/text/tex_mobject.py:277, in MathTex.__init__(self, arg_separator, substrings_to_isolate, tex_to_color_map, tex_environment, *tex_strings, **kwargs)
    275 self.tex_strings = self._break_up_tex_strings(tex_strings)
    276 try:
--> 277     super().__init__(
    278         self.arg_separator.join(self.tex_strings),
    279         tex_environment=self.tex_environment,
    280         tex_template=self.tex_template,
    281         **kwargs,
    282     )
    283     self._break_up_by_substrings()
    284 except ValueError as compilation_error:

File ~/checkouts/readthedocs.org/user_builds/physics-555-quantum-technologies/conda/fall2024/lib/python3.11/site-packages/manim/mobject/text/tex_mobject.py:80, in SingleStringMathTex.__init__(self, tex_string, stroke_width, should_center, height, organize_left_to_right, tex_environment, tex_template, font_size, color, **kwargs)
     78 assert isinstance(tex_string, str)
     79 self.tex_string = tex_string
---> 80 file_name = tex_to_svg_file(
     81     self._get_modified_expression(tex_string),
     82     environment=self.tex_environment,
     83     tex_template=self.tex_template,
     84 )
     85 super().__init__(
     86     file_name=file_name,
     87     should_center=should_center,
   (...)     95     **kwargs,
     96 )
     97 self.init_colors()

File ~/checkouts/readthedocs.org/user_builds/physics-555-quantum-technologies/conda/fall2024/lib/python3.11/site-packages/manim/utils/tex_file_writing.py:65, in tex_to_svg_file(expression, environment, tex_template)
     62 if svg_file.exists():
     63     return svg_file
---> 65 dvi_file = compile_tex(
     66     tex_file,
     67     tex_template.tex_compiler,
     68     tex_template.output_format,
     69 )
     70 svg_file = convert_to_svg(dvi_file, tex_template.output_format)
     71 if not config["no_latex_cleanup"]:

File ~/checkouts/readthedocs.org/user_builds/physics-555-quantum-technologies/conda/fall2024/lib/python3.11/site-packages/manim/utils/tex_file_writing.py:212, in compile_tex(tex_file, tex_compiler, output_format)
    210         log_file = tex_file.with_suffix(".log")
    211         print_all_tex_errors(log_file, tex_compiler, tex_file)
--> 212         raise ValueError(
    213             f"{tex_compiler} error converting to"
    214             f" {output_format[1:]}. See log output above or"
    215             f" the log file: {log_file}",
    216         )
    217 return result

ValueError: latex error converting to dvi. See log output above or the log file: media/Tex/7c4051dc2bef7999.log
Warning
We need a Manim >= 0.15.0 to get this to work, resolving issue 2441 by embeding the video in the output.